PRODUSCTS

PRODUSCTS
PRODUSCTS

Huachuang Cloud System
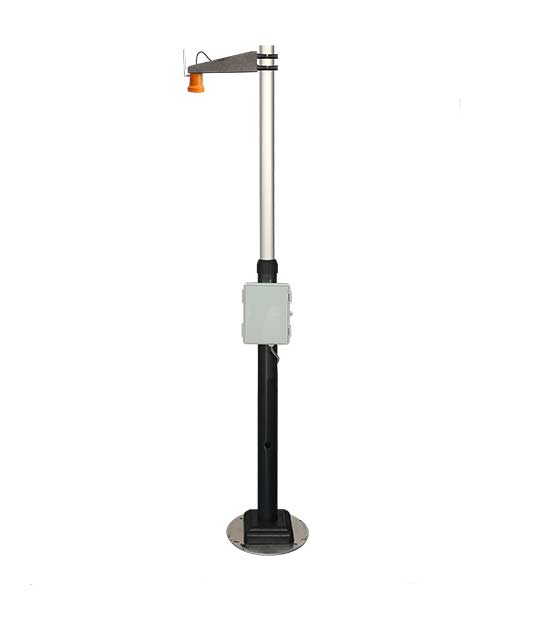
Application:Water level measurement
Measuring Range:0~30m
Signal Output:RS485 MODBUS-RTU or wireless
Antenna Type:Integrated lens antenna design
Mounting method:Installing by bracket
Beam angle:6°
Power supply: Solar power+lithium battery/electric supply
Display mode: Computer web on PC and APP on mobile
Signal transmission: GPRS、2G、3G、4G
Working Frequency:(76~81)GHz

Product introduction
In modern industrial production, environmental and hydrology detection, level, pressure, and temperature measurement play an important role. In industrial automation systems, measured data such as level, pressure, and temperature can ensure the safe operation of devices to prevent accidents, as well as enhance the degree of factory automation to improve production efficiency. Because some measurement occasions do not have on-site power supply, wireless measurement products show great advantages.
Our company's Internet of Things product is a wireless remote measurement equipment that integrates solar power, measuring instruments, and wireless transmission equipment. The apparatus transfers the measuring signals to the cloud server through GPRS or 4G (CHL, CHU, CHA), deploys a C/S architecture cloud platform server, and displays the data via web pages and APP. The platform also supports remote control, alarm push, report generation, map positioning, etc. The configuration interface can also be designed according to customer requirements to display the equipment process flow chart.
Our products use high-performance servers, advanced IoT systems, powerful database software, and precise measuring instruments, which will provide stable and reliable measurements and satisfactory services.


1.It can be widely used in large irrigation areas, lakes, rivers, reservoirs and tidal water level monitoring.
2.The independent solar power supply system is convenient and fast.
3.It ensures continuous power supply for more than 3 days without sunlight.
4.The signal transmission of specially customized RTU and DTU devices is stable; together with the independently developed IoT system and high-performance Alibaba Cloud platform servers, it can provide users with stable and reliable measurements.
5.View data on mobile terminals and web clients anytime, anywhere.
1. Card display
Parameter card function, shown on monitoring interface, display various values, status of devices and other contents in the form of cards, with clear interface and convenient observation.

Map scene
GIS (Geographic Information System) can display various location information on the map; users can directly obtain project and device information on the map. They can also click the map icon to check project details.

3.Configuration display
Configuration display is to present various information collected from automatic processes and equipment in graphical and other more understandable ways, which can realize the monitoring and control of automatic processes and equipment. It displays real-time data, animations, values, charts, videos, maps... Multiple data statistics and analysis make data monitoring more intuitive.
Through the configuration function, the big data of each parameter that needs to be monitored can be displayed on the same screen, allowing users to understand all big data information covered by the system on the interface.

4.
Alarm warning
Preset alarm conditions to realize early warning and alarm functions. When the collected data exceeds the set high and low range values, abnormal communication occurs, or pipeline leakage is detected, the platform can automatically send alarm information such as SMS, email, voice, and WeChat to the administrator to control the abnormal operation in a timely manner.

5. Data report
Functions of data report: supporting users to collect data in various ways, including daily report, monthly report, annual report or interval report. You can use the report to view how the monitored data changes over time.

Application


Technical data


South of Puhui Street, west of Guangsheng East Road, High tech Zone, Fengnan District, Tangshan City, Hebei Province


Technical support:

Tips
Submitted successfully
Back Index